∞
Arbitrary N-Port Support
Full support for .s1p, .s2p, .s3p … .snp files. No limit on port count — analyze any multi-port network.
⇌
S/Y/Z Matrix Conversion
Convert between S-parameters, admittance (Y) and impedance (Z) matrices with mA, ri, or dB formatting.
≈
Frequency Interpolation
Interpolate s-parameter data to any frequency grid. Useful for combining datasets measured at different frequency points.
⊙
Smith Chart View
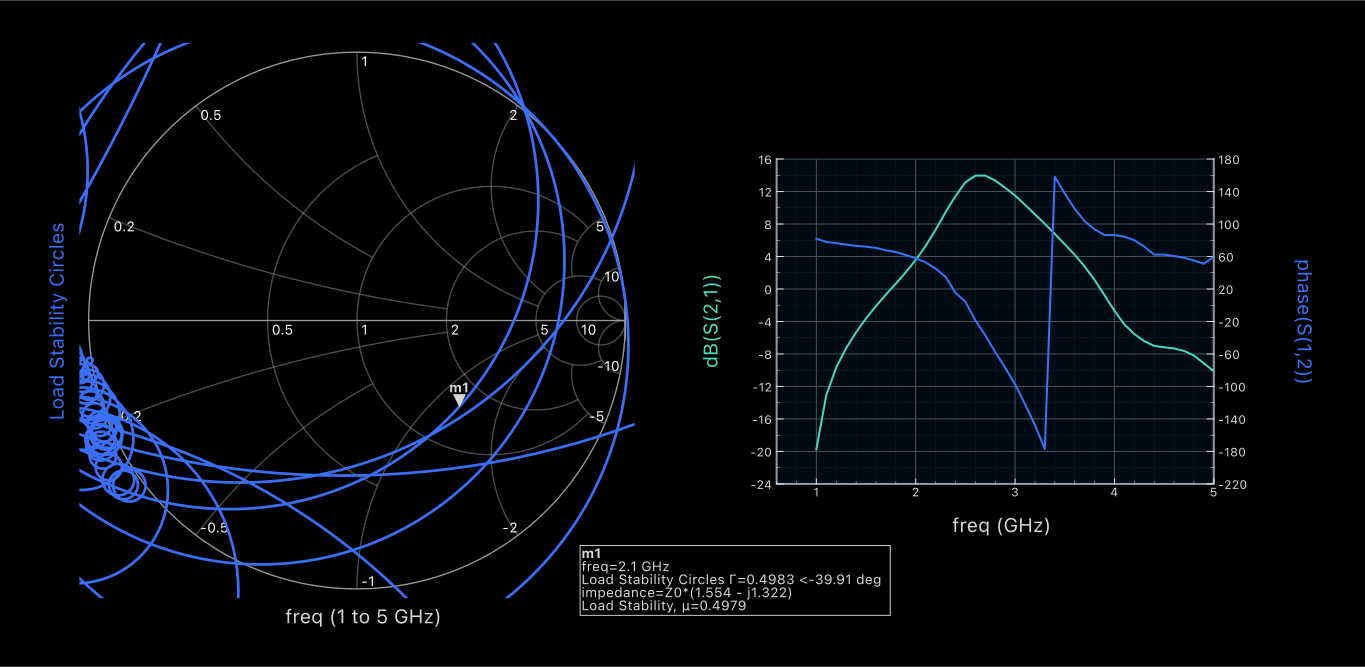
Industry-standard Smith chart display with constant resistance and reactance circles. Visualize impedance across the full bandwidth.
📈
Rectangular Plot View
Magnitude and phase vs. frequency in rectangular format. Dual y-axis display for simultaneous mag and phase.
⬛
Automated Grid Layout
Automatically arranges all S-parameter plots in a grid. Display properties and configuration saved within file comments for repeatability.
🗜
ZIP Archive Support
Read s-parameter files directly from .zip archives — no extraction required. Streamlines batch file management.
✦
Vector PDF Export
Export any plot as publication-quality vector graphics to PDF. Scales cleanly to any resolution for reports and presentations.
💾
Persistent Configuration
Plot display properties and layout configuration are saved within file comments, ensuring reproducible views every time you open a file.